US Leading Economic Indicators Tumble For 13th Straight Month, “Weaknesses Were Widespread”
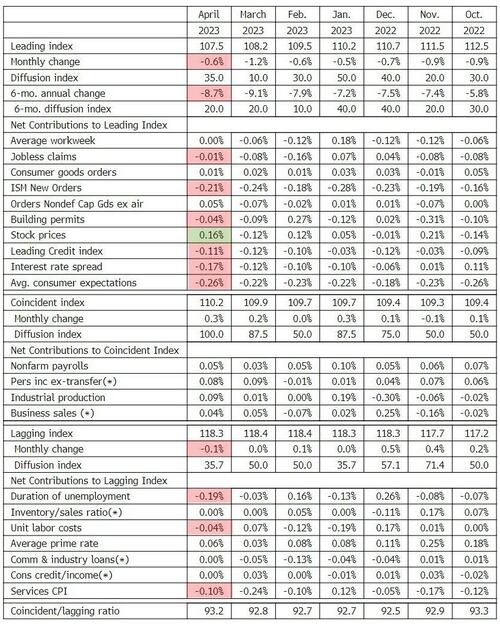
The Conference Board’s Leading Economic Indicators (LEI) continued its decline in April, dropping 0.6% MoM (in line with the 0.6% decline expected).
The biggest positive contributor to the leading index was stock prices at 0.16
The biggest negative contributor was average consumer expectations at -0.26
This is the 13th straight monthly decline in the LEI (and 14th month of 16) – the longest streak of declines since ‘Lehman’ (22 straight months of declines from June 2007 to April 2008)
“The LEI for the US declined for the thirteenth consecutive month in April, signaling a worsening economic outlook,” said Justyna Zabinska-La Monica, Senior Manager, Business Cycle Indicators, at The Conference Board.
“Weaknesses among underlying components were widespread—but less so than in March’s reading, which resulted in a smaller decline.
Only stock prices and manufacturers’ new orders for both capital and consumer goods improved in April.
Importantly, the LEI continues to warn of an economic downturn this year.
The Conference Board forecasts a contraction of economic activity starting in Q2 leading to a mild recession by mid-2023.”
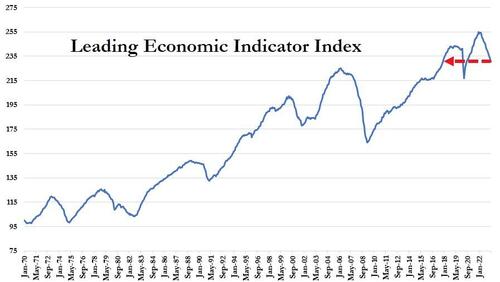
Despite ‘soft landing’ hype, the LEI is showing no signs at all of ‘recovering’, hitting its lowest since Dec 2017 (outside of COVID)
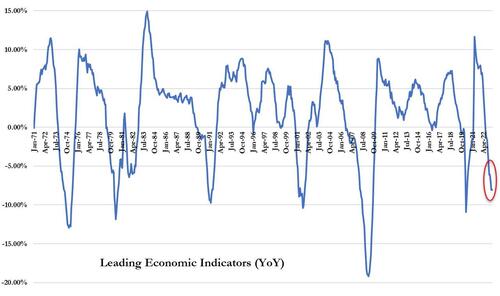
And on a year-over-year basis, the LEI is down 8.09% – close to its biggest YoY drop since 2008 (Lehman) outside of the COVID lockdown-enforced collapse…
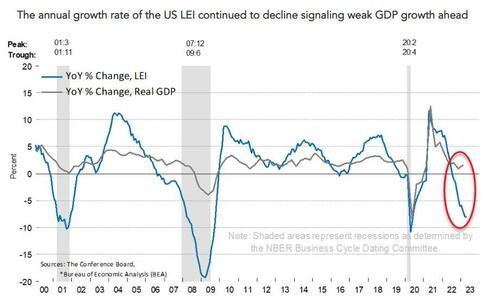
Not a good sign for GDP…
The trajectory of the US LEI continues to signal a recession over the next 12 months
Is this the cleanest view of The Fed’s tightening impact on the US economy?
Tyler Durden
Thu, 05/18/2023 – 10:29


