“Selling The Rips”: Retail Investors Capitulate Just As Stocks Break Out To New 2023 Highs
Over the weekend, when writing about the shift in hedge fund positioning in the past two weeks during which we observed bearish capitulation as stocks broke out to new 2023 highs, we said that this was the first material “sentiment shift” of 2023, driven by “FOMO Frenzy, Hedge Fund Buying.” Yet not everyone was on board.
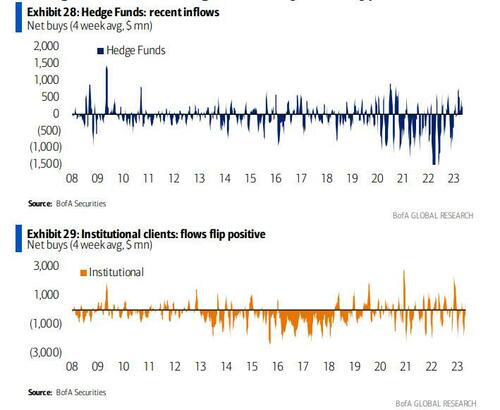
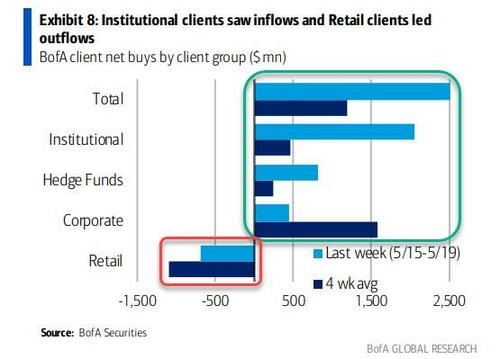
According to Bank of America’s Jill Carey Hall, who keeps tabs on the bank’s client flow trends, last week was indeed one where most bears capitulated as BofA clients were net buyers of US equities with the biggest inflows since Oct. (+$4.4B): “Both stocks and ETFs saw inflows, led by the former. Despite “risk on” flows, inflows were chiefly in large caps (mid caps also saw inflows – largest since Dec.).“
These massive flows over the past two weeks were driven by institutional & hedge fund clients, as we already discussed…
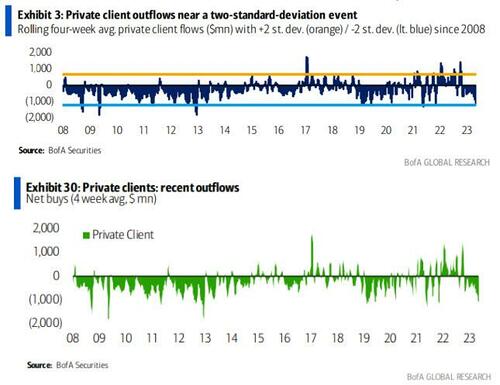
… but on the other end were the bank’s private clients (i.e., high net worth retail investors) who were capitulating: according to BofA, “Private clients were sellers for the 8th straight week and are the biggest sellers YTD”
Here are the details:
Rolling 4-wk. avg. sales by retail are the largest since Oct. ‘21 and close to a two-standard-deviation event.
Our GWIM survey suggest heightened levels of sideline cash and shifts into bonds/cash from equities this year.
Needless to say, capitulations are infallably bullish events, and this one should be no different. According to Hall’s calculations, the S&P 500 has been up more than average over the next 1, 3 and 6 months four of the last five times when there was a -2 std dev event in retail flows since ‘09 (with avg. 1/3/6 mo. S&P returns of 2%/4%/8%).
And sure enough, BofA writes that it just upgraded its outlook for stocks (as noted on Monday, the bank raised its S&P 500 target to 4300), “in part because of capitulation-like trends out of equities.”
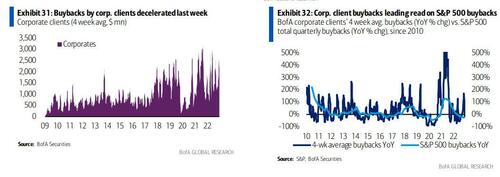
As an aside, with retail quietly exiting stage left, corporate buybacks also slowed for a second week after tracking above typical seasonal trends throughout April during earnings season. BofA calculates that YTD corp. client buybacks as a % of S&P 500 mkt. cap (0.10%) remain slightly above 2022 highs at this time (0.09%).
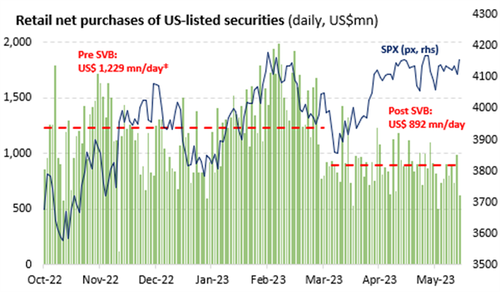
A separate report by Vanda Research confirms as much: according to Vanda’s Marco Iachini, even though the S&P 500 is within striking distance of its 2023 peak, retail investors are not chasing the rally as they usually do when the market keeps grinding higher. Indeed, the average daily flow into US markets has stayed near or below $900MM/day for all but one day over the past two weeks. That’s been the trend since the SVB fallout kicked off the broader banking crisis: as if retail investors lost their mojo when the regional bank crisis started… either that or retail kept averaging down into the collapsing stock price until everything was lost. During this period, average daily retail flows have dropped roughly 27% below the mean of the past two years (chart below).
According to Vanda, there “clearly has been a sentiment shift” as growth/recession worries have dominated market narratives. Such behavior is characteristic of end-of-cycle phases, during which retail traders are more reluctant to chase rallies as aggressively as in the earlier parts of the market cycle. Nonetheless, under the surface, retail traders have remained more active than the net level of inflows would suggest.
Below Vanda shares some more observations on the latest
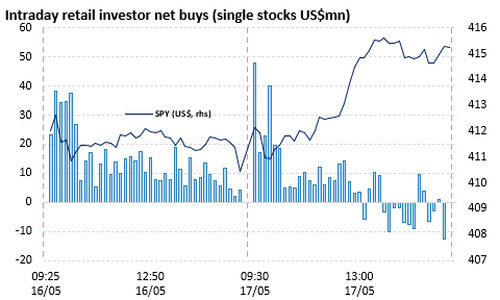
- Individual traders are selling, rather than chasing, the rallies. Last Wednesday’s intraday flow action is quite telling of retail sentiment as of late. The contrarian bias remains strong as individual traders are selling equity rips more aggressively than typically seen over the past year, i.e., rallies tend to see a decline in net flows rather than consistent outflows, as seen on Wednesday (chart below).
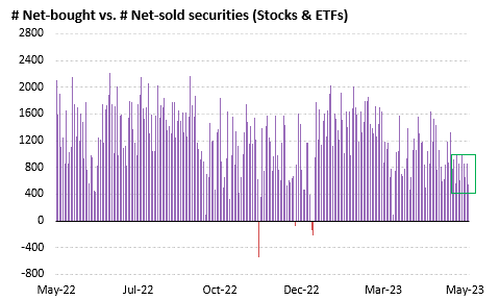
- The breadth of purchases has declined. While overall net flows are still subdued, the breadth of stocks and ETFs bought vs. sold points to no capitulation in sight (chart below). That may seem odd given the weakness in net flows, but it’s indicative of a retail community still inclined to actively trade these markets, although perhaps on a more cautious stance given the myriad of risks on the horizon.
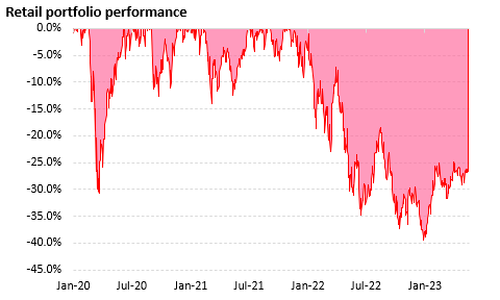
- The average portfolio P&L has improved but is still significantly negative. The cautious stance seems understandable given the poor state of the average retail portfolio (~27% below all-time highs). Recent tech gains have been able to more-than-offset losses in financials, but with recession risks staying top of mind, it is no surprise that retail traders are treading carefully.
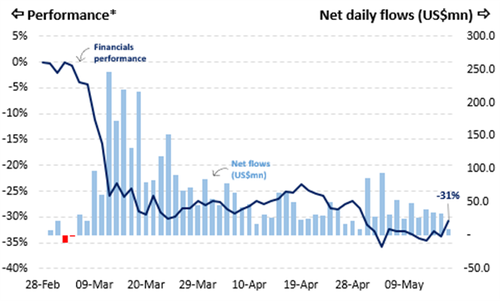
- Retail investors have scaled back purchases of regional banks during the recent rebound. The most frequently asked question clients ask us is whether retail traders are still buying financials and regional banks amid the lack of institutional inflows. That appears to be the case still, but the latest data also show that the level of retail buying has scaled back significantly (blue bars in the chart below).
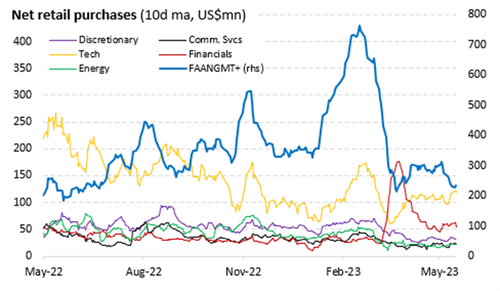
- Additionally, the chart below suggests that while financials remain the third-largest beneficiary of retail inflows, retail traders slightly rotated towards non-FAANGMT+ names over the past week (yellow line). This will only accelerate after today’s NVDA blowout results.
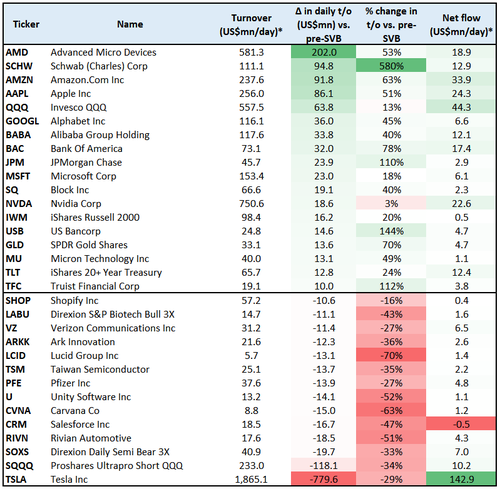
- Big tech cements its lead as retail’s preferred trading ground, although financials are also in the mix. The table below shows that while the former has failed to attract as large net flows as before the SVB debacle, it remains retail traders’ most active hunting ground from a turnover perspective. Unsurprisingly at the same time, financials saw the biggest percent increase in activity. Though other popular but smaller names have seen turnover drop significantly, particularly EV producers (Lucid, Rivian). The key standout from the table below is Tesla. The stock has seen a considerable decline in turnover (-29%) and net flows (US$ 142.9 vs. US$ 328 mn/day) before and after SVB. Nevertheless, it remains by far the most popular retail target across the entire securities universe.
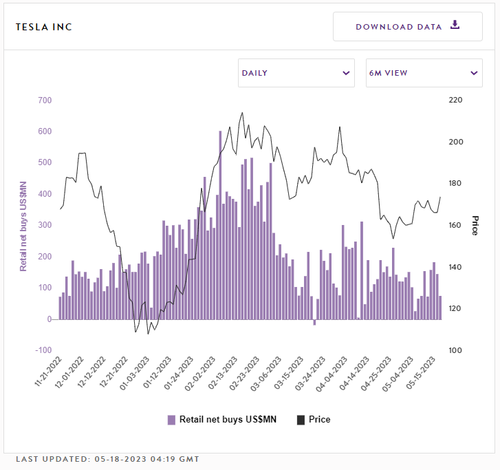
- Watch TSLA for signs of improvements in retail appetite. As discussed above, TSLA is still the ultimate retail favorite stock from both a turnover and net flow perspective. Announcements at this week’s annual shareholder meeting sent the stock higher, which is now +15% above the end-of-April trough. Given its popularity, it tends to lead retail flows into the broader equity universe; therefore, we’ll watch it closely to see whether the recent price rebound can sustain its upward trend and attract momentum-chasing flows. Increasing appetite for this name will likely give an early indication of any return in broad retail participation in the stock market.
More in the full BofA note available to pro subs in the usual place.
Tyler Durden
Wed, 05/24/2023 – 17:50

